Dashboard
Monitor your Workspace at a glance plan usage, Session activity, and errors in one place.
The Dashboard is the landing page of your Workspace. It shows how much of your Service Plan you have used in the current billing period, how your workflows are performing, and where errors are occurring so you can spot trends and fix issues before they impact users.
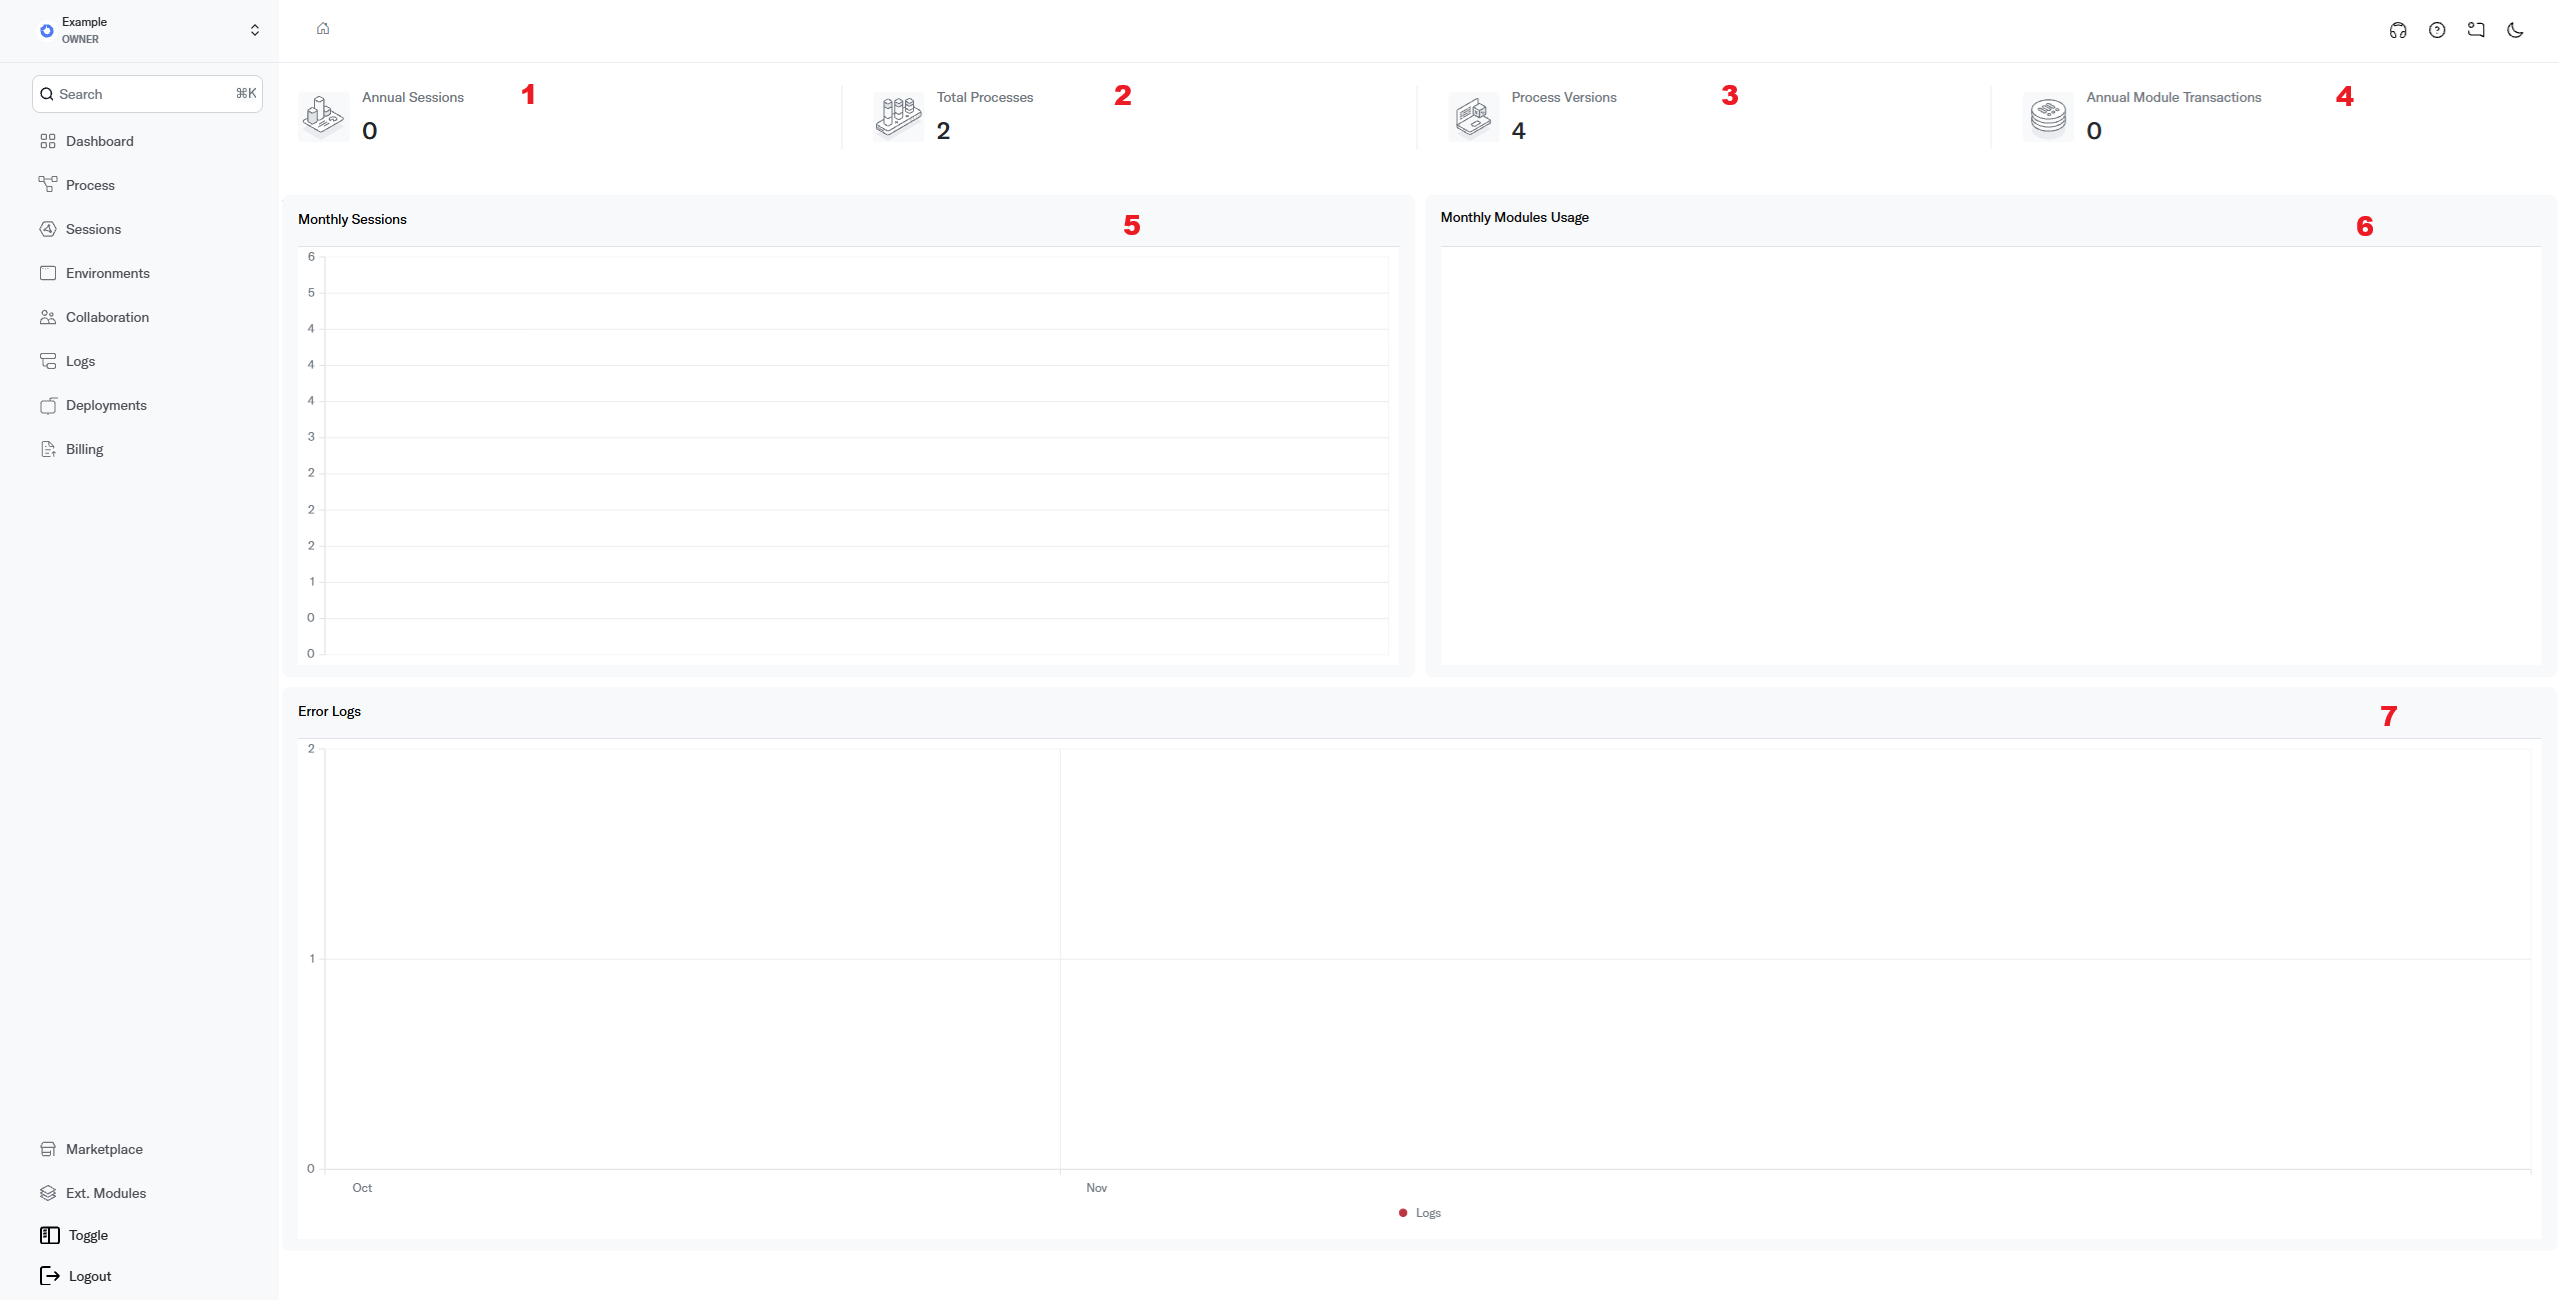
How it works
Most metrics on the Dashboard are scoped to your current billing period the date range of your active Service Plan cycle, shown at the top of the page. Activity counters (Executions, Failed, Execution Time, Transactions, AI Tokens) start again from zero when a new period begins, while capacity metrics (Processes, Collaborators, Storage, Dynamic Modules) always show your current totals.
While you view the current period, the metrics refresh automatically every 30 seconds; the timestamp in the bottom-right corner shows when the data was last updated (in your local time). Cards with a progress bar measure your usage against a Service Plan limit a limit shown as ∞ means your plan places no cap on that metric.
If your Workspace is new, the Dashboard shows No Data Available until your first workflows run.
Fields
Metrics data retention varies according to your Service Plan. See the Pricing page for retention details.
Billing summary
The card at the top of the page summarizes your subscription:
- Plan badge the name of your current Service Plan (Free when you have no paid plan). On the Free plan, a Get a Plan button takes you to the billing page.
- Billing Period the start and end dates of the period you are viewing. When previous periods exist, arrow buttons let you step back through them (see Actions).
- Period progress a progress bar with the days remaining and the percentage of the period already elapsed.
- Cancelling badge shown when your subscription is set to end at the close of the period, together with the cancellation date.
- Payment failed banner a red banner appears above the Dashboard when your last payment attempt failed, with a link to update your payment method.
Environment health
When your Workspace has Environments, an Environments strip appears below the billing summary with one pill per Environment, most recently active first. Each pill shows the Environment name and its Process, a colored dot for the outcome of its most recent run, small tick marks for the outcomes of its latest runs (oldest to newest), and how long ago it last ran. Click a pill to jump to the Sessions page.
Metric cards
One card per key metric. Cards with a usage bar count against your Service Plan limits:
- Executions the number of workflow runs (Sessions) started in the current billing period, measured against your plan's execution limit with a usage bar.
- Failed how many of those runs ended with an error, and what percentage of all executions that represents.
- Execution Time the total time your workflows have spent running this period (shown in minutes, hours, or days), with the average duration per execution below.
- Processes the number of Processes in your Workspace, measured against your plan's Process limit. The line below shows how many Process versions were created during the period.
- Collaborators the number of team members in the Workspace, measured against your plan's collaborator limit. Invitations count only once they are accepted see Collaboration.
- Transactions the total number of Task steps your workflows executed during the period, with the average amount of data a Session carries below.
- Storage the total storage your workflows use across the Workspace, measured against your plan's storage limit. Storage is cumulative it does not reset with the billing period.
- AI Tokens the AI tokens the built-in AI Assistant consumed in the current billing period, measured against your plan's token allowance. Everyone in the Workspace draws from the same allowance, and the counter resets when a new period begins.
- Dynamic Modules the number of custom Modules in your Workspace, each running in its own dedicated container, measured against your plan's Dynamic Module limit.
While you view the current period, some cards carry extra signals. Executions, Failed, and AI Tokens show a small arrow chip comparing activity with the previous billing period it appears from your second period onward. Executions and AI Tokens also project your end-of-period usage from the current pace; if you are on course to run out, the projection turns into a warning with the date the limit would be reached. When usage on the Executions, Storage, or AI Tokens card passes 80% of its limit, an Upgrade shortcut appears on the card, taking you straight to Billing.
Live activity
While you view the current billing period, three live panels appear between the charts:
- Running Now the workflow runs executing at this moment, refreshed every 10 seconds. Each row shows the Process, the Environment, when the run started, and how long it has been running measured against your plan's maximum execution duration where one applies. Runs taking much longer than usual for that workflow are flagged (× slower than usual), runs paused for input show a waiting chip, and test runs carry a test badge. The header shows how many runs are active now and this period's peak of simultaneous runs against your plan's concurrency limit.
- Upcoming Runs the next scheduled triggers due to fire: how soon each fires, the workflow and Environment it starts, and whether it is recurring or one-time. A warning icon marks a trigger whose recent start attempts failed. View all opens the Scheduled tasks page.
- Recent Deployments your five most recent Deployments, each with its Process, Environment, how long ago it happened, and a status chip. View all opens the Deployments page.
These panels are hidden while you browse a past billing period.
Charts
- Sessions Over Time a stacked bar chart of Sessions per day, one color per Process. The 7d, 2w, 30d, and This Period buttons change the time range.
- Channels / Tags a donut chart of executions by Channel, with a per-Channel count list below. Switch the card to Tags to see executions by the outcome tag your workflows set with SetTagTask: the four most used tags, the rest folded into Other, and executions without a tag as Untagged. Billing periods from before tags existed show channels only.
- Errors Over Time a line chart of the daily error count, with a badge showing the period total. The time range selected on Sessions Over Time applies here too.
- Session States a donut chart of the period's Sessions by their state: Completed, Running, Waiting, Error, or Stopped.
Recent Errors
This table appears only when your workflows produced errors in the last 24 hours. Identical errors are grouped, and the ten most frequent are listed:
| Field | Description |
|---|---|
| Count | How many times this error occurred in the last 24 hours |
| Environment | The Environment where the error occurred |
| Error Code | The error's short code name see Error Codes |
| Message | The error message (truncated hover to read the full text) |
| Last Seen | The time the error last occurred, in your local time |
Actions
Browse a past billing period
- Navigate to the Dashboard from the sidebar.
- In the billing summary card, click the left arrow next to the Billing Period dates to step back to an earlier period.
- Review the metrics past periods show the values frozen at the end of that period.
- Click the right arrow to return toward the current period; live updates resume once you reach it.
Change the chart time range
- On the Sessions Over Time card, click 7d, 2w, 30d, or This Period.
- Both the Sessions Over Time and Errors Over Time charts redraw for the selected range.
Use This Period to compare chart activity directly against the usage bars on the metric cards both then cover the same date range.
Best practices
- Check the Dashboard regularly the Errors Over Time chart and the Recent Errors table surface recurring issues before end users report them.
- Watch the usage bars when Executions, Storage, or AI Tokens approach their limit, upgrade your Service Plan before your workflows or the AI Assistant are affected.
- Compare past periods step back through billing periods to spot growth trends and seasonal patterns in your Session volume.
Related pages
- Sessions drill into individual Session details.
- Logs view the full error log for your Workspace.
- Process manage your Processes and versions.
- Collaboration invite and manage team members.
- AI Assistant the assistant whose usage the AI Tokens card meters.